
Healthy and sick patients alike turn to lab tests to measure exactly what’s going on inside their bodies. Similarly, both successful and struggling companies can use data (the marketingequivalent of a lab test) to measure which of their content pieces bring the greatest health to the company.
Data has weighed heavily on the minds of marketers over the past year. Informatica blogger Myles Suer declared 2016 as “The Year of Data and Relevance.” DataOn blog speculates that “2016 will be the year in which the world will start producing more data than we can store.”
Marketers are finding more and more ways to use data to drive their strategies to success. There’s still plenty of time to bring data into your marketing efforts, particularly in regard to your content marketing strategy.
Data Reveals What the Consumer Craves
Content paired with data creates the marketer’s Holy Grail: relevance. A data-driven content strategy ensures you’re getting relevant information in front of the right audience at the right time.
When a marketer can see which of their content pieces earned the most clicks, which held the viewer’s attention the longest, and which sent consumers to sales pages most often, they can streamline content strategy and increase content ROI.
The great irony is that today’s marketers are drowning in a sea of data and aren’t putting it to good use. Research has shown that companies that utilize data-driven marketing perform better. The Content Marketing Institute’s 2016 B2B content marketing study found that 57% of companies list measuring content effectiveness as a top challenge — and 52% have trouble measuring the ROI of a content marketing program. Despite these difficulties, many companies recognize how important it is to use data when creating a content strategy; a Forbes Insights report explains that those making marketing decisions based on data are six times more likely to report higher profits than competitors.
Clearly, many marketers are playing catch-up in the data game. This post will bring you up to speed as we go over which data you should use to determine your company’s best content topics, writers, word counts, and more.
Content Metrics in Google Analytics
With Google Analytics, marketers can understand which pieces of content are most viewed, downloaded, shared, and appreciated overall. They can then get to work creating more content in the same vein. Google Analytics is not only a free resource but an exceptionally powerful one — it shows marketers which pages rank where, making it the best and most relevant arbiter of good content.
Perhaps the biggest reason marketers can rely on this resource is that Google Analytics wants to provide businesses with the best information — so that those businesses can provide the best content for Google’s users. After all, when a consumer searches a phrase on Google’s website, they expect to receive useful content from reliable sources; Google’s ability to meet that expectation is what keeps consumers coming back.
For marketers, this means you and Google have the same goals for the informational content you produce. The more relevant to consumers your content is, the more traffic and leads you’ll draw into your business. And the more relevant to searchers’ queries that information is, the better the search engine’s quality becomes.
This is why you should view Google Analytics data as a guidepost for creating dynamite content.
Where to Find Data about Content Relevance, Quality, and Appeal
To properly measure data that you can use to guide your content strategy, first integrate Google Analytics into your company’s website. Once that’s done, follow the directions below to view four highly useful insights about your website visitors’ interactions with your content.
1. Time on Page
When you identify which of your content pieces users spend the most time with, what you’re discovering is what your customers want to see. A 1,500-word piece that holds readers’ attention for an average of 20 seconds is failing in its duties — the call-to-action is likely at the end of the piece, after all. When people open a piece of content and then click away very quickly (also called “bouncing”), they aren’t exposed to calls-to-action, or links to any sales, download, or contact pages.
Use your analytics data to find posts that are performing well so you can use them to inform your future content strategy. You can also use the data to identify underperforming blog posts so you can revisit them and make them more relevant for your readers. Use the insight gained from your top-performing posts to make these updates.
To find how long people are staying on your pages on average, follow this path in your Google Analytics account (make sure to scroll down so you don’t miss it):
- Audience > Behavior > Engagement
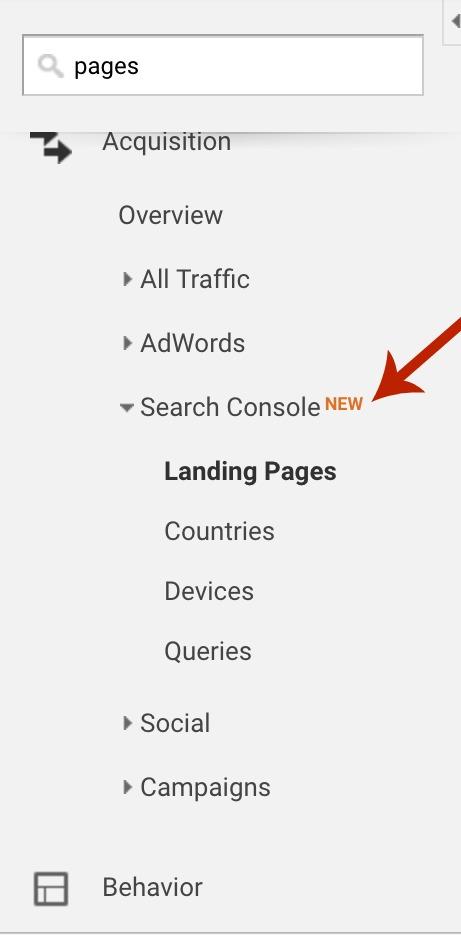
You can view time-on-page statistics and clicks for specific pages by following this path:
- Acquisition > Search Console > Landing Pages
2. Top Pages
Sorting by top pages will show you which pages on your website are receiving the most traffic, showing you which pages are ranking, and how popular they are.
Top pages data can be used to guide strategy and add opportunity. When building a new content strategy, take a close look at the highest ranked pages and note any similarities in the subject matter, format, and style. Are any of these aspects consistent throughout the highest performing posts? If so, keep this in mind when preparing your next strategy.
Looking at top pages will also reveal any opportunities for optimizing past content to add touch points and calls to action. If a top performing page is out of date, update it and distribute the change. Check for any missed opportunities: is there a call to action on this page? Are there any new pieces of content that are related to this page that you can link to? Completing an audit of your top pages should be something that is done at least quarterly, and incorporated into any ongoing content strategy.
To view top pages, take the following path in Google Analytics:
- Audience>Site content>All Pages
3. Referrals
One of the best ways to tell whether your content is resonating with people is to see whether other webmasters are linking to it from their sites. To determine the level of respect your content is earning, take a look at how many other websites or blogs refer to it. You can do this by reviewing your content’s “referrals.”
Take the following path to get this information:
- Acquisition > All Traffic > Referrals

When you click on the word Referrals, all of the websites that sent a click your way will be displayed. The list is sorted in descending order by default, so the content getting the most traffic comes up at the top.
While looking at referrals, there are three things to take note of:
- Types of content referred to
- The type of publications driving traffic to your site
- Quality of the traffic
The types of content that appear the most in your referral traffic will show you the types of content that people are interested in — are your evergreen posts driving the most referrals, or is your current events coverage? Knowing what kind of referrals you’re receiving for different types of content will help you to decide the breakdown of your future content efforts.
Taking note of the types of publications that are driving traffic to your site will help you to identify potential targets for guest post outreach — and a bonus — if a site has linked to your blog already, they’re more likely willing to work with you on guest posts in the future.
Finally, the quality of the traffic (e.g. bounce rate, time on site, pages visited) will show you what publications send you the highest quality traffic with the most qualified leads, and will guide your outreach efforts in the future.
4. Interests
Yep. You’ve heard right — Google knows (almost) everything about us. They gather our interests, through the words we type in the search bar and the websites we visit. Many Americans have given Google all kinds of information in order to access Google Analytics, Google Maps, Gmail, Google Calendar, and other amazing tools.
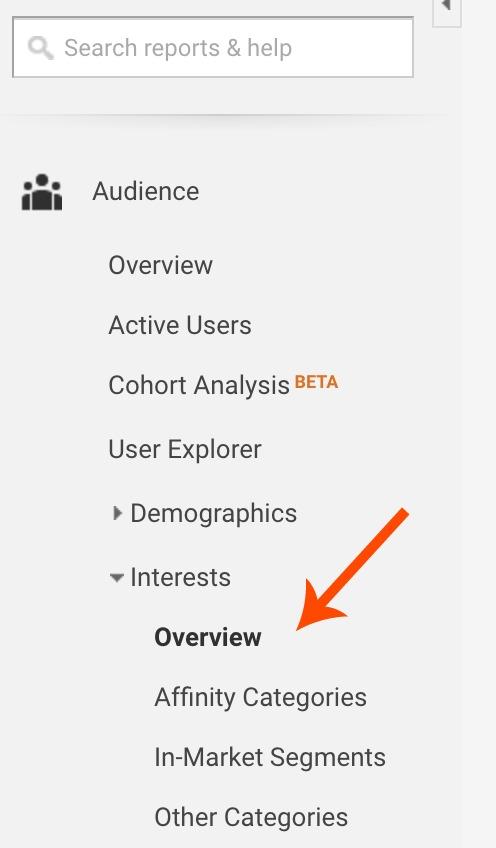
All of this collected data helps businesses understand more about their customers. To take a look at Interests, follow this path within your Google Analytics account:
- Audience > Interests > Overview
Google separates interests into three groups: Affinity Categories, In-Market Segments, and Other Categories.
Once you get your Affinity Categories set up via Google Analytics, you can create segments based on these dimensions. Many digital marketers use this information to remarket (or retarget) to those who have already visited the company’s website or Facebook page. After all, it takes multiple touches before a buyer asks for information or converts.
In-Market Segments provide the data that reveals what searchers are in the market for. Google knows they were recently shopping for shoes, homes, or cars. Google puts these searchers in categories based on their behavior; the searchers don’t choose themselves. As a result, the data may sometimes be inaccurate.
Under the Other Categories tab, you will find very specific verticals. Where the Affinity category could be “cars,” the Other category would be “BMWs” or “Toyotas.” Marketers looking to create very small target audiences will come to depend on the consumers’ Google tags as members of these Other Categories.
How to Use This Data
The key to extracting insights from your Analytics data is to track it and revisit it over time. At Main Path Marketing, we send our clients a monthly report that examines the critical data they are looking to track. Monthly reporting check-ins are a great way to evaluate your efforts and see how they are contributing to your goals.
Keep your marketing strategy healthy and in tip-top shape by examining it regularly, assessing what’s working and what’s isn’t, and adjusting accordingly.
All the (free!) data available on Google Analytics ensures every marketer can make informed choices on content topics and audiences. It can be difficult for marketers to find the time to learn the subtleties of Google Analytics, so whether you take the time to learn the ins and outs of Google Analytics yourself or enlist someone to help, don’t leave this information goldmine untapped. Use it to build, monitor, and refine your content marketing strategy for success.
Image Credit: tongcom photographer/Shutterstock
Author : Ilana Plumer
Ilana Plumer is the Senior Director of Marketing at RelationEdge Digital Agency, which provides premium level content marketing services to mid-market businesses. With over 12 years of marketing experience, Plumer builds and oversees holistic content marketing campaigns for her clients. Plumer is committed to integrating content marketing with social media, digital PR, and email marketing to elevate her clients’ brand voice.